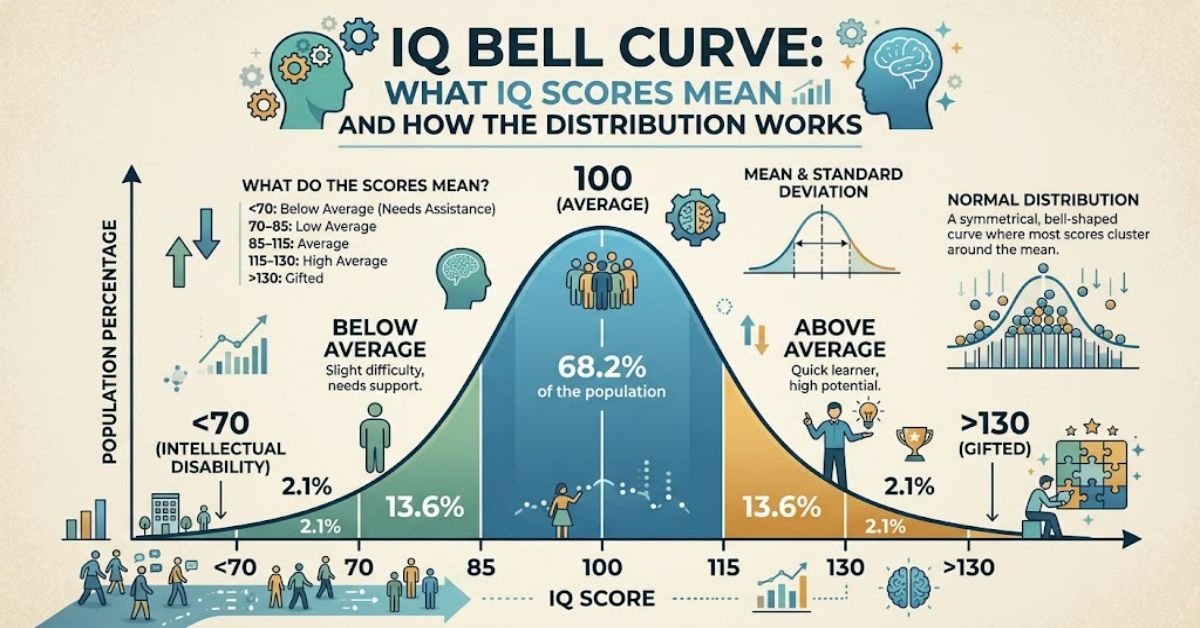
An IQ bell curve is a symmetrical, bell-shaped graph that shows how intelligence test scores spread across a large population. The concept is closely connected to standardisation: instead of treating a raw number of correct answers as an IQ score, modern tests compare performance with a norm group and transform the result onto a standard scale.
For many widely used intelligence tests, the average is set at 100 and the standard deviation is 15. That means a score of 100 represents the norm-group mean, while scores further above or below 100 represent increasingly unusual positions within that reference distribution. The American Psychological Association describes deviation IQ in these terms and notes that modern IQ scores are generally standard scores rather than the mental-age ratios used in early intelligence testing.
The curve is useful because it turns abstract statistics into a visual model. It helps explain why a score of 115 is not 15 per cent “more intelligent” than a score of 100, and why small numerical differences near the centre of a distribution can have a different percentile meaning from differences at the extremes.
However, the graph is also easy to misunderstand. It describes the statistical distribution of scores produced by a particular standardised assessment. It does not prove that intelligence itself is perfectly distributed in a mathematical bell shape, nor does it mean that every population will have precisely the same distribution.
Understanding that distinction is essential when interpreting IQ results.
What Does the IQ Bell Curve Show?
The basic curve represents a distribution of standardised scores.
Imagine a large group of people taking an appropriately standardised intelligence test. The test developers establish norms from a defined population. Individual results are then interpreted according to where they sit within those norms.
A conventional scale might look like this:
| IQ score | Standard deviations from 100 | Approximate percentile* | General statistical position |
| 70 | -2 SD | 2nd | Far below the mean |
| 85 | -1 SD | 16th | Below the mean |
| 100 | 0 SD | 50th | Mean |
| 115 | +1 SD | 84th | Above the mean |
| 130 | +2 SD | 98th | Far above the mean |
*Percentiles are approximate theoretical values for a normal distribution. Actual test interpretation depends on the specific test’s normative data.
The important point is that the distance between scores is measured in standard deviations. On a scale with a mean of 100 and standard deviation of 15, an IQ of 115 is one standard deviation above the mean.
The APA notes that slightly more than two-thirds of scores on the usual IQ scale fall within 15 points of the mean, while more than 95 per cent fall between 70 and 130 under the normal-distribution model.
Why Is the Average IQ 100?
The number 100 is a convention created through test standardisation.
It does not mean that 100 represents a universal quantity of intelligence. Instead, test publishers establish a reference population and scale scores so that the normative average has a specified value.
The same principle appears throughout psychological measurement. A norm-referenced test establishes norms by administering an assessment to a defined standardisation group and using the resulting distribution to interpret later scores.
This is why the meaning of an IQ score depends partly on the test’s norms.
A score obtained from an older version of an assessment should not automatically be treated as equivalent to the same numerical score from a newly normed version. Changes in population performance are one reason psychological tests are periodically renormed.
Pearson’s current WAIS-5, published in 2024, illustrates this process. Its development included updated norms based on data collected in 2023–2024, reflecting the importance of contemporary normative samples.
Standard Deviation and IQ Scores
Standard deviation is one of the most important concepts behind the curve.
It describes the spread of scores around the mean. A smaller standard deviation indicates that observations are more tightly clustered, while a larger one indicates greater dispersion.
For a commonly used IQ scale:
- Mean = 100
- Standard deviation = 15
- 85 = one standard deviation below the mean
- 115 = one standard deviation above the mean
- 70 = two standard deviations below the mean
- 130 = two standard deviations above the mean
This makes the curve easier to interpret.
A score of 130 is not simply “30 points better” than 100 in an everyday numerical sense. It represents a position two standard deviations above the normative mean.
That distinction is one of the most important pieces of information the graph communicates.
IQ Percentiles Are Not the Same as IQ Points
Percentile ranks often create confusion because they do not increase in a straight line with IQ.
Under an ideal normal distribution, moving from 100 to 115 moves from approximately the 50th percentile to the 84th percentile. Another 15-point increase, from 115 to 130, moves to approximately the 98th percentile.
| IQ difference | Statistical movement | Approximate percentile change |
| 85 → 100 | -1 SD → mean | 16th → 50th |
| 100 → 115 | Mean → +1 SD | 50th → 84th |
| 115 → 130 | +1 SD → +2 SD | 84th → 98th |
| 70 → 85 | -2 SD → -1 SD | 2nd → 16th |
This shows why IQ should not be interpreted like a percentage score on an examination.
Someone scoring 120 has not answered “20 per cent more intelligence” than someone scoring 100. The number represents relative standing within a normed scoring system.
What Happens at the Ends of the Curve?
The centre of the distribution contains many more people than the extreme ends.
This means relatively small changes in the central range can represent substantial changes in percentile rank, while interpreting very high or very low scores requires greater care.
The tails of a distribution are statistically sparse. A score near an extreme therefore represents a much less common position than a score near the mean.
But rarity should not be confused with a complete description of an individual.
An intelligence assessment can contain multiple index scores and subtests. Contemporary Wechsler assessments, for example, examine areas including verbal comprehension, working memory, processing speed and fluid reasoning rather than treating cognitive ability as a single undifferentiated skill. The WAIS-5 introduced separate visual-spatial and fluid-reasoning indexes alongside expanded measures of working memory and other abilities.
That is an important practical limitation of a simple bell curve: the graph compresses complex assessment information into one visual distribution.
A Bell Curve Does Not Mean Everyone Is Identical
The statistical model is useful, but it does not eliminate individual differences.
Two people can receive the same overall IQ while showing different patterns across cognitive domains. One might have relatively stronger verbal comprehension, while another performs better on visual-spatial or processing-speed tasks.
The British Psychological Society’s guidance on IQ testing highlights this issue. Its discussion of the WAIS notes that assessment can be interpreted at the global composite, index and subtest levels, and that substantial differences between index scores can affect how meaningful a Full Scale IQ is for some individuals.
This is one reason professional assessment does not normally stop at reading a single number from a graph.
Why Measurement Error Matters
A test score is an estimate, not an infinitely precise measurement.
Professional assessments can report confidence intervals around composite scores to reflect measurement uncertainty. Pearson’s WISC-V interpretive materials, for example, explain that obtained scores reflect true ability combined with measurement error and that confidence intervals can provide a more appropriate representation of the likely range of an individual’s true score.
This has an important implication: treating an IQ score of 109 and one of 110 as fundamentally different levels of ability would give the numbers more precision than the assessment supports.
The Flynn Effect and Changing IQ Norms
One of the most important challenges to simplistic interpretations of the IQ bell curve is the Flynn effect.
Research associated with James Flynn documented substantial increases in average scores on intelligence tests across generations during the 20th century. Cambridge’s summary of Flynn’s work describes the phenomenon as a major increase in IQ test scores over time.
The practical consequence is significant: an IQ scale is tied to its norms.
If a test’s normative sample becomes outdated, comparing contemporary individuals against that sample can distort interpretation. The American Psychological Association has previously described the practice of periodically renorming intelligence tests to account for changing population performance.
This gives the bell curve a less obvious dimension. It is not a permanent map of human intelligence. It is a statistical representation tied to a particular assessment and reference population.
Comparing Different Intelligence Tests
Different tests can use similar-looking scales without being interchangeable.
| Assessment | Main population | Broad purpose | Key consideration |
| WAIS-5 | Adults and older adolescents | Comprehensive cognitive assessment | Updated norms and multiple cognitive indexes |
| WISC family | Children and adolescents | Cognitive assessment | Age-specific normative interpretation |
| Brief intelligence tests | Children and adults, depending on test | Shorter assessment | Less comprehensive than full batteries |
| Online IQ quizzes | Varies | Informal entertainment or screening | Often lack professional standardisation |
The first three categories represent formal assessment approaches, but their purposes and administration requirements differ.
Online quizzes create a separate problem. A website can display a bell-shaped chart and assign an IQ number without having the psychometric foundation of a professionally developed assessment.
The presence of a graph does not itself establish validity.
Three Practical Insights When Reading an IQ Bell Curve
The curve describes relative position, not personal worth. An IQ score answers a specific measurement question under specific testing conditions. It does not summarise character, creativity, motivation, emotional maturity or every form of human capability.
The test’s norms matter as much as the number. A score cannot be interpreted properly without knowing which assessment produced it, which normative population was used and how the result was calculated.
A single composite can hide meaningful variation. When index scores differ considerably, examining the pattern may provide more useful information than focusing exclusively on the Full Scale IQ. British Psychological Society guidance specifically discusses situations where an overall score may be less meaningful because of uneven performance across domains.
These points are particularly important when IQ scores are used in education or clinical contexts, where decisions can have consequences beyond simple curiosity.
Real-World Uses and Limitations
Intelligence tests have been used in educational, clinical and research settings for decades. Their appropriate use depends on the assessment question, the quality of the instrument and the expertise of the person interpreting it.
The British Psychological Society describes comprehensive intellectual assessment as potentially useful for distinguishing broad intellectual difficulties from more specific cognitive weaknesses. It also stresses the importance of considering different aspects of cognitive functioning rather than assuming that one overall number captures every relevant difficulty.
Testing standards similarly emphasise systematic test development and evidence supporting the interpretation of scores. The Standards for Educational and Psychological Testing are jointly associated with the American Educational Research Association, American Psychological Association and National Council on Measurement in Education.
The limitation is not necessarily that IQ testing has no value. Rather, its value depends on what is being measured and how the result is used.
A bell curve can describe a distribution accurately while still being insufficient for making an individual judgement on its own.
The Future of IQ Bell Curve Interpretation in 2027
The future of IQ assessment is likely to involve increasingly detailed normative models and more efficient digital administration.
The publication of the WAIS-5 in 2024 demonstrates this direction. Pearson describes updated norms, shorter administration options and expanded coverage of cognitive domains as key features of the new assessment.
Digital assessment may make administration and scoring more efficient, but it does not remove the need for psychometric validation. A computerised test still needs appropriate norms, reliability evidence and valid interpretations.
Another issue will be keeping normative data current. Generational changes in test performance mean that a score’s interpretation cannot be separated entirely from when and how the test was standardised.
The most useful future approach is therefore unlikely to be a rejection of the bell curve. Instead, it will involve placing the curve in better context: identifying the reference population, explaining uncertainty and considering patterns across cognitive domains.
Key Takeaways
- The IQ bell curve is a statistical model for understanding the distribution of standardised intelligence scores.
- A mean of 100 and standard deviation of 15 are common features of major IQ scales, but not universal rules for every assessment.
- Percentile ranks describe relative position and cannot be read as equivalent to IQ points.
- Standardised scores depend on the normative population used to construct the assessment.
- The Flynn effect demonstrates why older norms can become inappropriate for interpreting contemporary scores.
- Modern intelligence assessments examine multiple cognitive domains, making a single composite score an incomplete description in some cases.
- Confidence intervals and professional interpretation help prevent false precision when reading individual results.
Conclusion
The IQ bell curve is useful because it provides a straightforward statistical framework for understanding how standardised intelligence scores are distributed. It explains why 100 is commonly used as the mean, how standard deviation creates meaningful reference points and why percentile ranks change unevenly across the scale.
Its limits are just as important. The curve does not measure intelligence independently of a test, and an IQ score does not represent every aspect of cognitive ability. Results depend on the assessment, its standardisation sample, administration conditions and interpretation.
Modern intelligence testing also demonstrates why norms cannot be treated as permanent. Research on changing test performance and the continuing development of assessments show that the meaning of a score is connected to the population and period in which it was normed.
For that reason, the most responsible way to interpret an IQ result is not to focus on the number alone. The test’s purpose, cognitive indexes, percentile rank, confidence interval and normative reference all provide essential context.
FAQ
What is an IQ bell curve?
An IQ bell curve is a visual representation of how standardised intelligence scores are distributed around a mean. On many commonly used scales, the mean is 100 and the standard deviation is 15.
Why is 100 the average IQ?
100 is a standard-setting convention used when intelligence tests are normed. It represents the mean of the reference population rather than an absolute quantity of intelligence.
What IQ is one standard deviation above average?
On a scale with a mean of 100 and a standard deviation of 15, an IQ of 115 is one standard deviation above the mean. Under an ideal normal distribution, this corresponds to approximately the 84th percentile.
Is an IQ of 130 on the top of the bell curve?
No. A score of 130 is two standard deviations above a mean of 100 on a scale with a 15-point standard deviation. It lies in the upper tail rather than at the centre of the curve.
Does everyone have an IQ that fits the bell curve?
The bell curve is a model for the distribution of scores within a particular norming population. Actual test distributions and individual results depend on the assessment, population and standardisation process.
Why do IQ scores change between tests?
Scores can differ because different tests measure somewhat different abilities, use different norms or have different measurement properties. Performance can also vary with testing conditions and other factors.
Can an IQ score change over time?
An individual’s test performance can change, and scores can also differ when different tests or updated norms are used. Interpretation therefore requires attention to the specific assessment and its normative framework.
Methodology
This article was researched using psychological assessment guidance, professional testing resources and publisher documentation. Particular attention was given to the distinction between raw performance, standardised scores, percentile ranks and normative interpretation.
The American Psychological Association was used for definitions of IQ, deviation IQ, standard deviation and standardisation. British Psychological Society material was used for context concerning professional intelligence assessment and interpretation of cognitive indexes. Pearson’s documentation was used for current information concerning the WAIS-5 and its updated normative approach.
No original IQ testing, clinical assessment or practitioner interview was conducted for this article. Consequently, no fabricated firsthand measurements or expert quotations have been included.
The approximate percentile figures in the tables describe the theoretical normal distribution and should not be treated as substitutes for the percentile tables supplied with a particular assessment. Actual interpretation should use the test’s own normative data and professional guidance.
Editorial disclosure: This article was drafted with AI assistance and should be reviewed by a human editor before publication. Named claims, statistics, references and technical interpretations should be checked against their original sources.
References
American Educational Research Association, American Psychological Association, & National Council on Measurement in Education. (2014). Standards for educational and psychological testing. American Educational Research Association.
American Psychological Association. (2018). APA dictionary of psychology: IQ. American Psychological Association.
American Psychological Association. (2018). APA dictionary of psychology: Deviation IQ. American Psychological Association.
British Psychological Society. (2017). Psychological assessment of adults with specific performance difficulties at work: IQ testing as part of the diagnostic process. British Psychological Society. https://doi.org/10.53841/bpsrep.2017.inf276.5
Flynn, J. R. (2012). Are we getting smarter? Rising IQ in the twenty-first century. Cambridge University Press.
Flynn, J. R. (2020). Secular changes in intelligence. In R. J. Sternberg (Ed.), The Cambridge handbook of intelligence (pp. 940–963). Cambridge University Press. https://doi.org/10.1017/9781108770422.040
Pearson Assessments. (2024). Wechsler Adult Intelligence Scale, Fifth Edition (WAIS-5). Pearson.