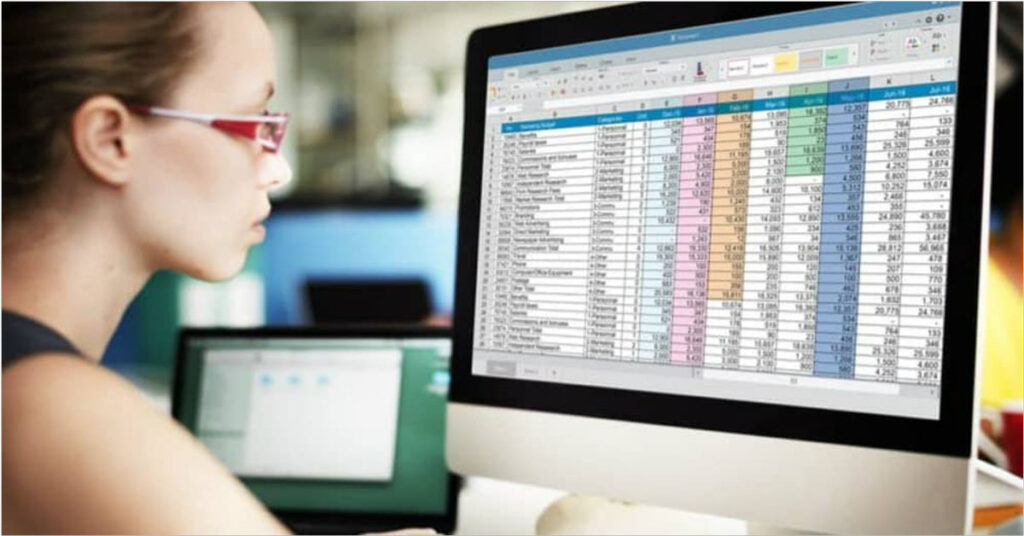
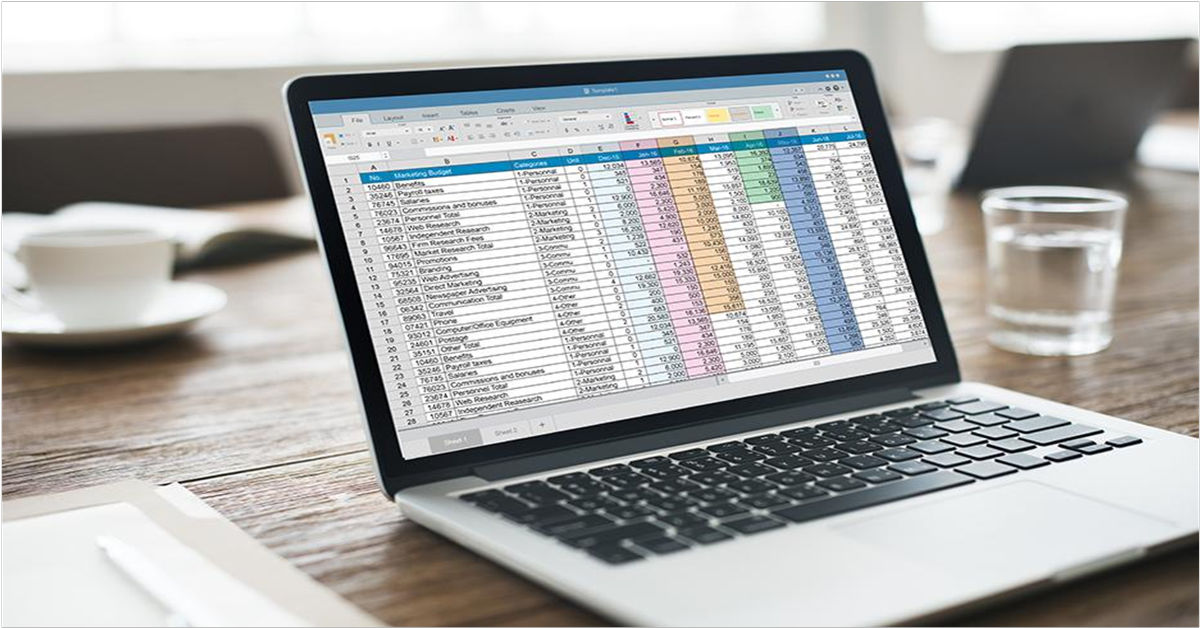
Excel is a powerful tool for managing data and analyzing Spreadsheet. It simplifies tasks with smart features like PivotTables, charts, and advanced formulas such as VLOOKUP or Goal Seek.
Tools like Microsoft Copilot take it further by helping with trends and predictions using AI. Excel works on Windows, macOS, iOS, and Android, making it flexible for many users.
The platform also supports teamwork with real-time collaboration online. Sharing files through OneDrive or Teams boosts productivity across groups. You can even automate repetitive steps using macros to save time.
From making graphs to summarizing data fast, Excel turns tough problems into simple solutions. Let’s dig deeper into how you can master these tools!
Key Features of Excel for Spreadsheet Analysis
Excel packs a punch by simplifying how we handle data. From crunching numbers to spotting trends, it turns messy info into clear, actionable insights.
Data visualization and graphing tools
Graphs and charts make data easier to understand. Excel offers tools like PivotCharts and a chart maker for this purpose. These tools help create clear visuals from raw numbers. Templates are available in over 40 categories for quick use.
Pie charts, bar graphs, and scatter plots can all be made with just a few clicks.
PivotTables simplify complex datasets into readable summaries. They work well with PivotCharts for better insights. For example, sales trends across months or regions become clearer through these visuals.
Over 1 billion downloads globally show how many value Excel’s visualization features.
Advanced formulas and functions
Goal Seek works wonders when solving for unknowns. It adjusts inputs to meet a fixed result in a formula. For example, if you want monthly savings to hit $10,000 in a year, Goal Seek finds the needed amount.
This tool simplifies planning without endless manual tweaks.
VLOOKUP and XLOOKUP speed up finding data in big files. VLOOKUP searches vertically, while XLOOKUP adds flexibility by scanning both rows and columns. They save hours of scrolling through messy spreadsheets.
Conditional Formatting enhances visuals by coloring cells based on rules like values above 100 turning green or below zero showing red signals.
Nested IF Statements handle complex choices with ease—they check multiple conditions step-by-step. Advanced array functions like FILTER or SORT go deeper into managing large datasets quickly and efficiently—cutting clutter so only what matters is seen upfront! These tricks make Excel courses like myexcelonline worth exploring!
Enhancing Efficiency with Excel

Save time and skip repetitive tasks with Excel’s smart tools. Dig into features that help you work faster while keeping things neat and simple.
Automating tasks with macros
Automating tasks in Excel Spreadsheet creates more time and reduces errors. Macros simplify repetitive work and boost efficiency.
- Record Repetitive Tasks
Click “Record Macro” to start. Perform the steps you want to automate. Excel records your actions in a step-by-step sequence. - Edit for Custom Needs
Adjust recorded macros to suit specific needs. Open the VBA editor, tweak the code, and optimize it for precise tasks. - Save Time on Daily Jobs
Use macros for things like formatting reports or calculating totals. They save hours by handling tasks in seconds. - Boost Accuracy
Automated processes reduce human errors. This is especially useful for finance or accounting professionals who handle large datasets. - AI Add-ins for Extra Power
Integrate AI tools with macros to predict trends or process natural language inputs quickly. - Share with Teams
Save macros in a shared workbook so everyone can use them, ensuring consistent output across the team.
Mastering PivotTables complements this by summarizing data effortlessly.
Using PivotTables for data summarization
PivotTables make handling large data sets faster and simpler. They help uncover trends, patterns, and insights without much hassle.
- Creating a PivotTable
Highlight the data range you want to analyze. Go to the “Insert” tab, then click on “PivotTable.” A dialog box will appear; select where you want to place your table (new or existing worksheet). Finally, click “OK,” and your PivotTable shell is ready. - Customizing with Functions
Add functions like Sum, Count, or Average to fields for specific calculations. For example, use “Sum” to see total sales or “Count” for the number of transactions. These options are available in the field settings. - Filtering Data Easily
Apply built-in filters directly within the table layout. This allows you to focus on specific entries or categories quickly. For added flair, use Slicers—an interactive tool that gives clear filter buttons for dynamic selection. - Visualize with PivotCharts
Create linked charts by selecting “PivotChart” from the toolbar after setting up your table. This gives a visual representation that updates automatically with any changes made in the PivotTable. - Keep Data Current
Refresh the table frequently whenever there are changes in your source file. Click on any cell inside the PivotTable, then select “Refresh” under the “Analyze” tab to sync it with new data. - Identifying Patterns and Trends
Group related items like dates by months or years for better insights. For instance, sales data grouped monthly can reveal seasonal patterns at a glance. - Experiment Freely Without Impacting Original Data
Drag and drop different fields into rows and columns to test combinations quickly. Your main dataset remains untouched while you explore possibilities within your analysis framework!
Conclusion
Mastering spreadsheet analysis with Excel Spreadsheet makes data work smoother and faster. Its tools, like formulas and PivotTables, save time and reduce effort. Features such as macros and cloud-sharing boost teamwork for better results.
Using these strategies can transform how you manage data daily. Start small, explore features, and grow your skills step by step. Your data expertise is just a few clicks away!


